

During the first six Terms of the Roberts Court (2005-2010), the U.S. Supreme Court has heard approximately 80 cases per Term on the merits, the vast majority (85.5 percent) from the thirteen U.S. Courts of Appeals. This article is the first to examine fully the Roberts Court’s affirmances and reversals of the U.S. Courts of Appeals.
Traditionally, respected observers such as the Harvard Law Review and SCOTUSblog calculate a Court of Appeals “track record” with a simple score card measure: for any given year, the ratio of the number of cases in which the Court reversed the circuit divided by the total number of cases decided by the Supreme Court from that circuit. This method is outcome driven, focusing on affirmances and reversals rather than the substance of the Court’s reasoning. So, for example, in 2010, the First Circuit scored a 0 percent reversal rate because the Supreme Court affirmed the only two decisions the Court heard from that circuit.
This traditional measure is incomplete and can be misleading. Again using the First Circuit from last Term as an example, our analysis reveals that the Court actually reviewed twelve First Circuit decisions (two directly in front of the Court and ten shadow decisions in circuit splits) and reversed the First Circuit four times, for a 33 percent full reversal rate.
Following a brief discussion of our methodology, we highlight the following conclusions: (1) the Supreme Court reverses the Courts of Appeals less often than is commonly thought; (2) the full measure of reversals identifies different Courts of Appeals as least reversed than those identified by the traditional method; and (3) in resolving circuit splits, the Supreme Court appears uninfluenced by the majority approach of the circuits. Our analysis also permits us (4) to construct a concordance table showing the degree to which the various Courts of Appeals agree with each other on the cases the Supreme Court decides, much like the concordance tables showing agreement among Justices’ voting. Overall, we believe this analysis, which takes into account cases directly in front of the Court as well as shadow decisions, provides a better understanding of the Supreme Court’s review of the Courts of Appeals.
The ‘Full Reversal Rate’ Measure
To obtain information on circuit splits, all of the Supreme Court merits decisions for the 2005 to 2010 Terms were reviewed.
Concerned that identifying a circuit split may be more art than science, we took our lead from the Supreme Court itself; we looked to the Supreme Court’s opinion to guide whether there was a circuit split and how the circuits ruled on an issue. In identifying a “reversal” or “affirmance,” moreover, we counted as a reversal any Court of Appeals approach that the Supreme Court did not accept. So, for example, if the Courts of Appeals presented three different approaches to interpreting a statute and the Supreme Court adopted one of those approaches, then the other two approaches were counted as reversals. If the Supreme Court rejected all three approaches in favor of its own, all three circuits would be marked as reversed.
This full method of evaluating reversals and affirmances has several advantages. Fundamentally, it is uses more information than the traditional one and so it is more accurate of the underlying reality that we are trying to assess; namely, the frequency with which the Supreme Court agrees with the approach of a Circuit Court. While the traditional method only focuses on the Roberts Court’s merits 397 decisions from the U.S. Courts of Appeals, including the shadow decisions expands the number of cases reviewed by more than two and a half times (1,069). The full reversal measure, unlike the traditional one, is thus more accurate in the sense that it captures the additional information from these additional cases.
Because the full approach generates more observations about each Court of Appeals, this approach also means that a Court of Appeals’ track record in any one year is more reliable. With only 70 to 90 merits cases a year on its docket, the Supreme Court will likely hear only a handful of cases from any given circuit. In 2010, for example, the Court reviewed five or fewer cases from seven of the 13 circuits. In contrast, using the full method, the Court essentially reviewed more than five times that number from those circuits (e.g., Second Circuit (4 (traditional) vs. 21 (full)), Third Circuit (5 vs. 15), Fourth Circuit (4 vs. 17), Seventh Circuit (5 vs. 17), Tenth Circuit (0 vs. 8), Eleventh Circuit (3 vs. 17), and D.C. Circuit (0 vs. 6).
Finally, unlike the traditional approach which measures just the outcome of case, the full approach focuses on Supreme Court’s reasoning and that of the Courts of Appeals.
We conclude the following from our analysis of the Roberts Court to date.
1. The Supreme Court Reverses the Courts of Appeals Less Than Conventional Wisdom Suggests.
At first blush and looking at published statistics, one might (incorrectly) think that the Courts of Appeals are doing a pretty mediocre job. The Roberts Court traditional reversal rate for its initial six years is 73.1 percent. By comparison, according to statistics published by the Federal Judiciary on its website, the Courts of Appeals reversed the District Courts less than 20 percent of the time. The predominant explanation for the high Supreme Court reversal rate is a kind of sample bias; the reversal rate is measured entirely from those cases where four or more members of the Court vote to grant certiorari, often to correct what they regard as mistakes.
Using the full measure, however, the Courts of Appeals reversal rate is substantially less; for the same period, the average was 56.4 percent. This rate is notable in several respects. First, it is approximately 17 percentage points lower than the traditional measure. This reflects that while the Supreme Court is, in part, taking some cases to reverse, it is also effectively affirming other circuits. The 56 percent reversal rate still seems somewhat high in comparison to the Court of Appeal reversal rate of District Courts (approximately 20 percent). One explanation is that although the full approach reduces the Court’s selection bias of granting cert to reverse, there remains the bias that the Supreme Court is selecting “tough cases,” i.e., circuit splits, where differences of opinion are likely. This type of bias is not present in District Court appeals to the Court of Appeals, where parties have a right of appeal and the selection bias turns on, among other things, the parties’ judgments about likelihoods of success, the amounts in controversy, and access to resources. Interestingly, the 56 percent reversal percentage also roughly approximates the rate by which plaintiffs lose in trial courts.
This explanation also is reinforced by a comparison of the reversal rates of cases involving circuit splits and cases that do not involve circuit splits. Under the traditional method, non-split cases are reversed 78.9 percent of the time, as compared to a reversal rate of 63.6 percent for cases involving circuit splits. Under the full method, this distinction is even more pronounced: non-split cases are reversed 80.3 percent of the time whereas split cases are reversed substantially less, only 48.3 percent of the time. This also supports the conventional wisdom that the Court’s predilection for granting certiorari to correct mistakes is strongest in non-split cases.
Finally, to some extent, the traditional and full measures pick up two different types of reversals: the traditional method captures a reversal on any ground, while the full one measures the Supreme Court’s rejection of a circuit court’s approach or reasoning.
2. The Full Reversal Measure Identifies Different Courts Of Appeals As Least Reversed.
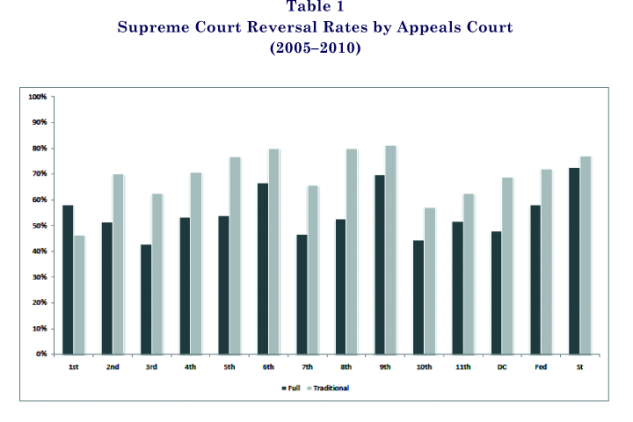
Which Courts of Appeals have the greatest success at the Supreme Court? Does the full measure identify different Courts of Appeals than the traditional measure? Table 1 answers these questions, displaying the reversal rates using the traditional and full methods, by circuit, for the Roberts Court.
The table reveals, not surprisingly, that when you unpack the average reversal rates across the circuits, there is considerable variability. Under the traditional method, the reversal rate ranges from 46.2 percent (1st Cir.) to 79.8 percent (9th Cir.) and the full method ranges from 42.6 percent (3rd Cir.) to 68.9 percent (9th Cir.).
The full reversal measure also reveals different “successful” (i.e., lower reversal rate) Courts of Appeals. It identifies the Third Circuit (42.6 percent) as the least reversed, with the Tenth Circuit (44.4 percent), Seventh Circuit (48.0 percent), and D.C. Circuit (50.0 percent) following closely. In contrast, the traditional measure fails to identify either the Seventh or the D.C. circuits as among the least reversed, and instead (misleadingly) identifies the least reversed appellate courts as the First Circuit (way out in front at 46.2 percent) and then the Tenth Circuit (57.1 percent) and the Third Circuit (62.5 percent). The biggest swing is with the First Circuit; it emerges as far less successful under the full method than the traditional method (46.2 percent traditional; 58.0 percent full).
The two approaches appear to converge in identifying the most reversed circuits; the Ninth Circuit was most reversed under either approach (79.4 percent traditional; 68.9 percent full) and then the Sixth Circuit (79.4 percent traditional; 66.3 percent full).
The identification of which Courts of Appeals have lower or higher reversal rates obviously does not answer the question of why this is the case. To address this inquiry, we intend in later work to use our expanded review of Courts of Appeals decisions to examine characteristics of the Roberts Court and the judges on the Courts of Appeals that were involved in the decisions reviewed by the Court and shadow decisions. See http://www.hangley.com/Supreme_Court_Project/
3. The Supreme Court Appears Uninfluenced by the Courts Of Appeals Majority Approach.
The data set on the Roberts Court also permits us to answer the question “In resolving a circuit split, how often does the Supreme Court adopt the rule applied by the majority of circuits?”
The answer is that it appears to make no difference to the Court as the Court followed the majority of the circuits 51.5 percent of the time and followed the minority approach 48.5 percent of the time. Of the 172 cases involving circuit splits from the Courts of Appeals, the circuits were evenly divided in 42 of the cases; of the remaining 130 cases, the Court followed the Court of Appeals majority approach 67 times and the minority approach 63 times.
We see two takeaways from this result. First, it is consistent with the common sense that on close questions, the Court is independent and does not just follow the majority of the circuits. Second, on these close questions, in the eyes of the Supreme Court, only about half of the Courts of Appeals “get it right.”
4. Concordance Among the Courts Of Appeals.
Useful concordance tables published by SCOTUSblog and others display the voting patterns of the Justices of the Supreme Court, identifying the frequencies with which each Justice votes with every other Justice. The results are not surprising. For the 2010 Term, for example, those tables show the greatest agreements between Justices on the conservative and liberal sides of the Court; Roberts-Alito, Sotomayor-Ginsburg, and Sotomayor-Kagan agreed the most, 96.2, 94.1, and 90.6 percent, respectively. The least agreement was between members of the two different wings; between Ginsburg and Alito, Roberts, and Scalia, 62.5, 64.6, and 65.0 percent, respectively. See Statpack 2010 Term, SCOTUSblog, 21 of 53, available at http://www.scotusblog.com/2011/06/final-october-term-2010-stat-pack-available/.
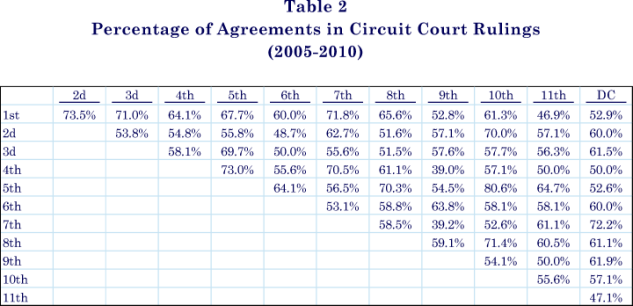
Displayed below is an analogous table (Table 2) showing the degree to which the circuits agreed with each other on the cases heard by the Roberts Court. Specifically, the agreement percentages are calculated as the number of agreements (both circuits affirmed or both reversed) divided by the sum of agreements and disagreements between the two circuits.
Several interesting patterns emerge from these data. First, the table shows which circuits are most and least aligned. The greatest agreement was between the Fifth and Tenth circuits (80.6 percent), the First and Second circuits (73.5 percent), and the Fifth and Fourth circuits (73.0 percent). The least agreement involved the Ninth Circuit (between the Ninth and Fourth circuits (39.0 percent) and the Ninth and Seventh circuits (39.2 percent)). This result is consistent with the conventional wisdom that the more conservative Fourth and Seventh circuits are at odds with the most liberal Ninth Circuit.
Second, there appears to be more disagreement among the Courts of Appeals than among the Justices of the Supreme Court. The Justices that voted together did so more than 90 percent of the time yet only one pair of circuits agreed 80 percent of the time and the next pairs were in the low 70 percentages. Likewise, the Supreme Court Justices who voted least often with each other did so only 62-65 percent of the time, yet the circuits agreed with each other far less, between 39 and 47 percent of the time. The cases analyzed, of course, were not all cases decided by the Courts of Appeals, just those that made it up to review by the Supreme Court. Hence, a likely explanation lies in the selection of cases for consideration; the circuit’s concordance is measured using cases where there is a circuit split while the Supreme Court Justice’s concordance is for all of the Court’s cases, most of which did not involve a split.
Learn more about Bloomberg Law or Log In to keep reading:
See Breaking News in Context
Bloomberg Law provides trusted coverage of current events enhanced with legal analysis.
Already a subscriber?
Log in to keep reading or access research tools and resources.